Episodes
To add a new episode, go to the edit window of the series/show, and there go to the “Seasons” tab. Then create or select a season and click on the + button to the right of it - this is the button to add a new episode. By clicking on the button, a line with a new series is added.
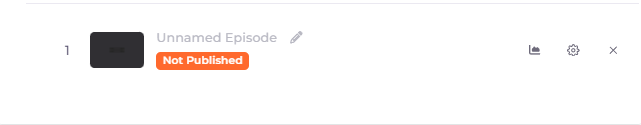
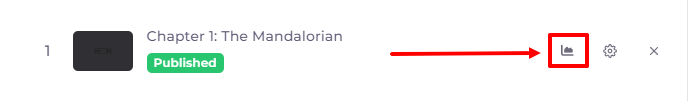
To edit an episode, click on its logo or on the gear icon to the right of the episode 
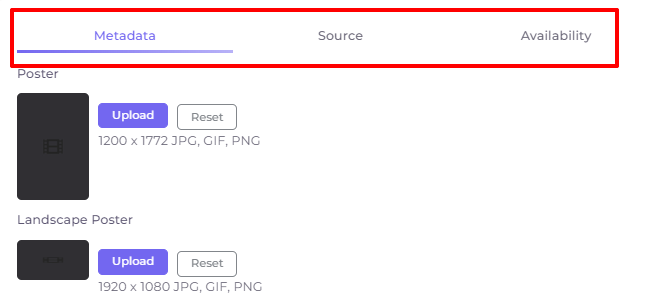
The episode editing window contains three tabs: Metadata, Source, and Availability.
It is important to fill in the Source to publish content correctly!
Metadata
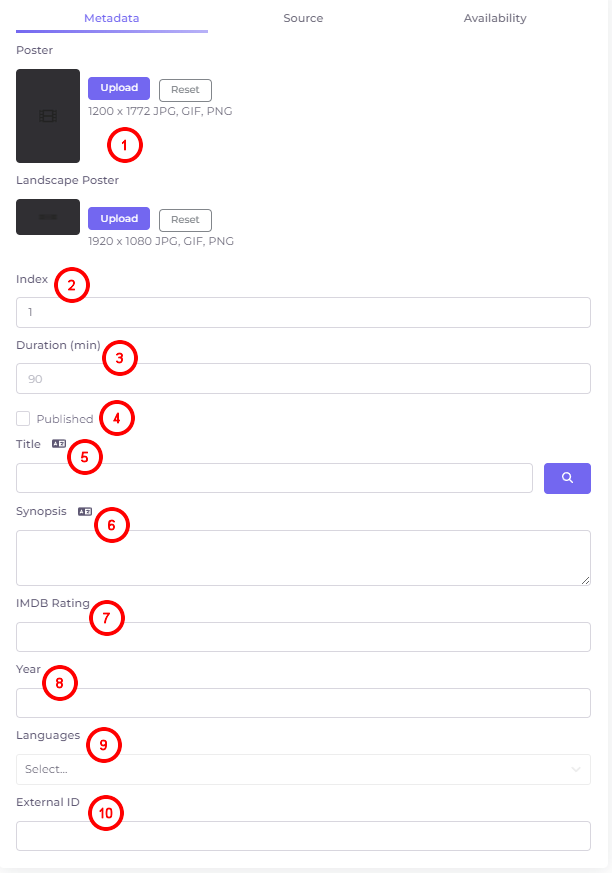
- Adding vertical and landscape (horizontal) poster to show in the episode list and on the episode page. Use the “Reset” button to clear the image in the editing window.
- Index - the number of the season.
- Duration - the duration of the episode displayed in the episode card to users.
- Published - this checkbox allows you to start publishing the season.
- Title - the title of the content unit. Above the title field there is a localization button
 , by clicking on which you can add a title in another language. To the right of the title field there is a button
  to search for metadata by title. The metadata found is written in the following fields. If they are not found, they can be entered manually.
 - Synopsis - episode description. Above the title field there is a localization button , by clicking on which you can add a synopsis in another language.
- IMDB rating.
- The year the episode was released.
- Voiceover and subtitle languages.
- External ID - is filled in automatically when importing content, when adding it manually it does not need to be filled in.
You can read about source customization and episode availability in separate articles.
Statistics
You can view episode viewing statistics in the Add/Edit Series/Show window on the Seasons tab by clicking on the statistics icon to the right of the episode:
A window like this will open:
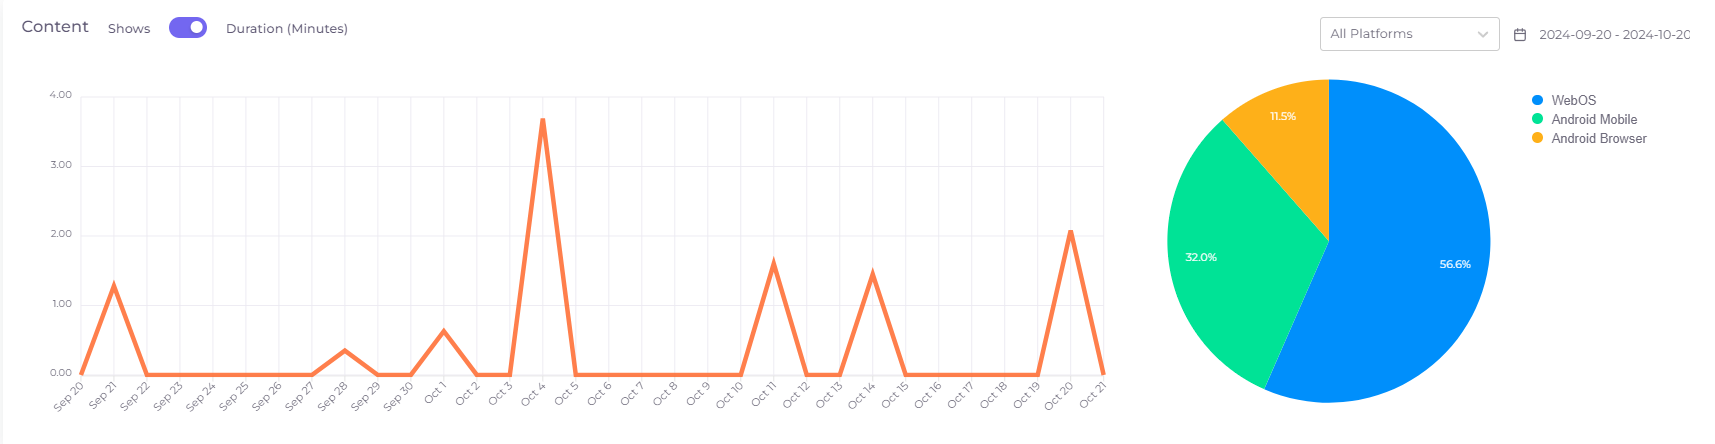
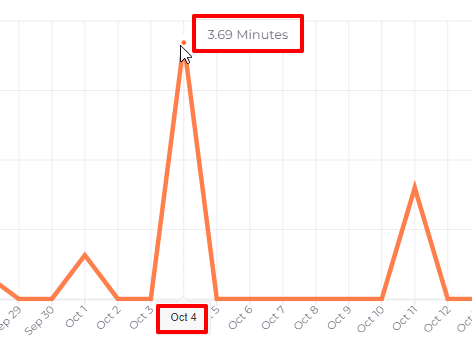
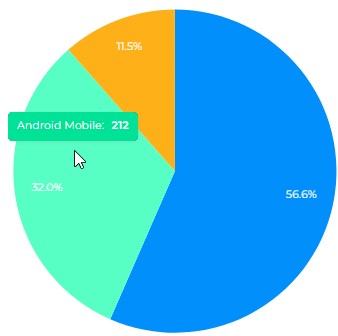
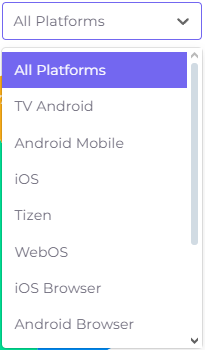
Statistics are presented as a line graph and as a pie chart to the right of this graph. The line graph shows the dynamics of episode viewing over the last month until today in shows or viewing duration, depending on the selected mode. The pie chart shows the distribution of this data across the platforms on which the Telebreeze app was used. In the upper right part of the statistics window there is a filter by platform, which allows you to see the viewing graph on a particular platform:
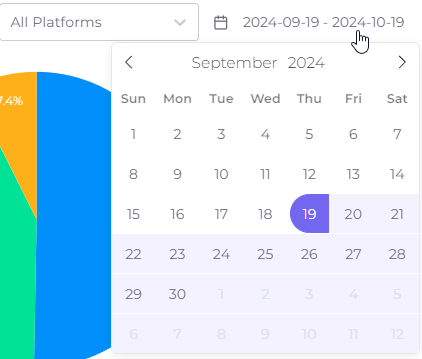
To the right of this filter there is the period of report generation, it can be changed by clicking on it:
Hovering the cursor over a graph point or chart sector will show the exact value at the point/sector: