Dashboard
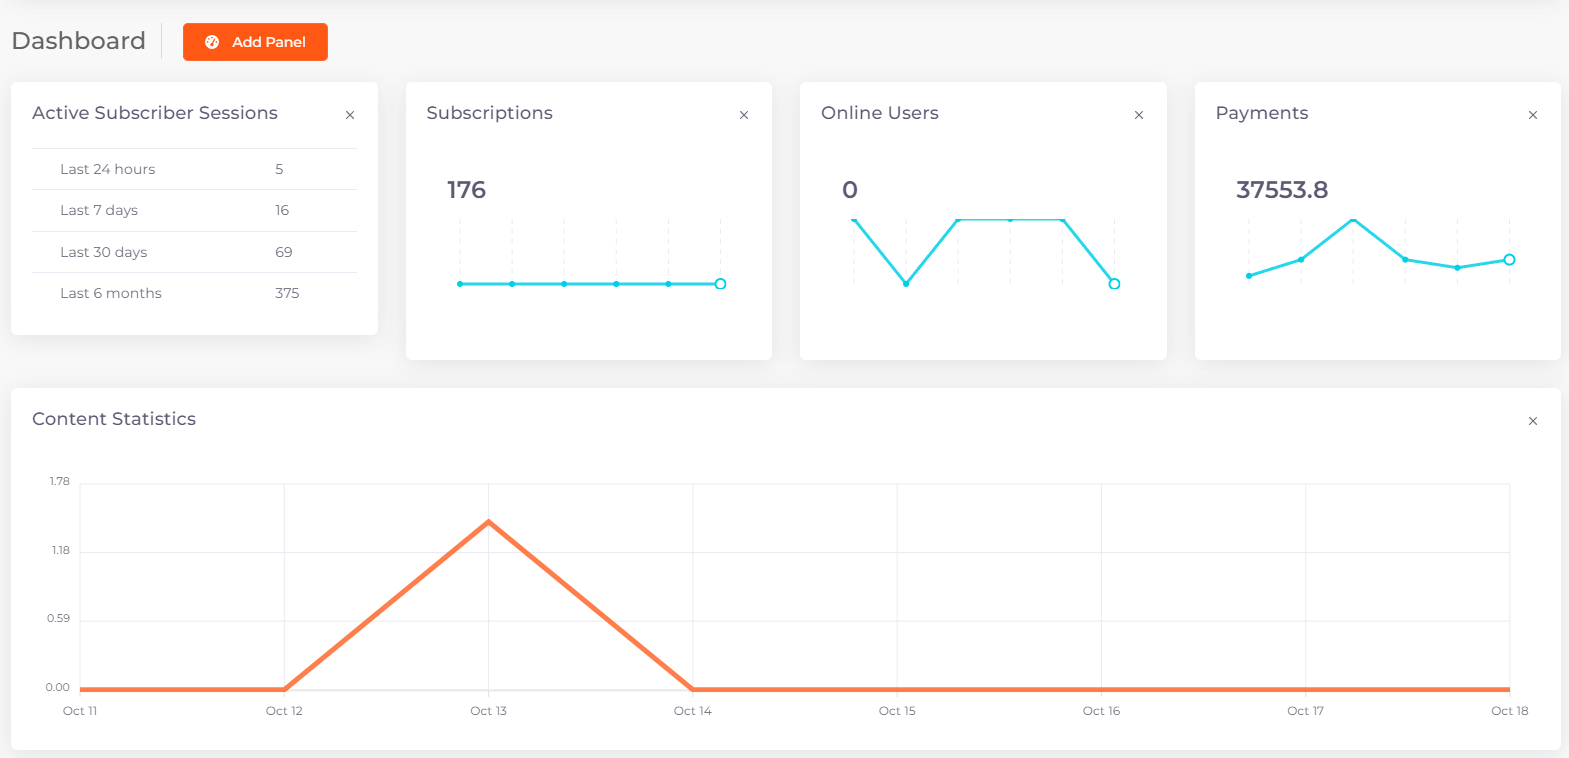
The main section of Telebreeze where the operator can see general useful information as well as real-time statistics. You can go to the dashboard by clicking on the corresponding item in the left menu. The dashboard includes a set of widgets. The widgets are customized and grouped at the operator's discretion. Here is an example of such a display:
Customizing the Dashboard
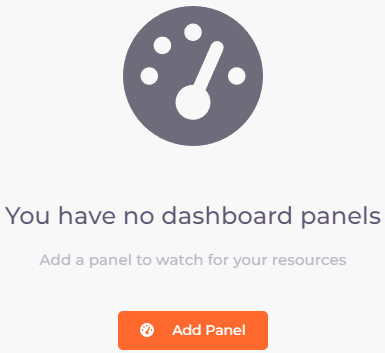
An unconfigured dashboard looks like an empty section:
To add a widget, click “Add Panel” and select the widget you want from the drop-down list.
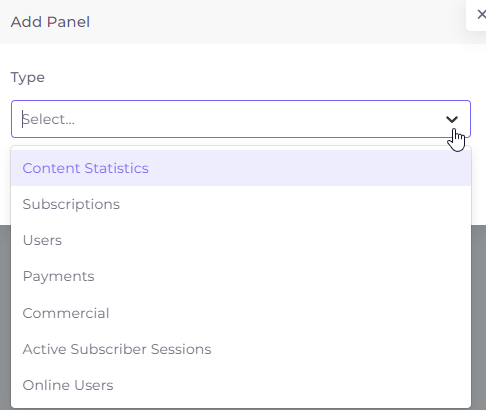
The widgets are described below.
After selecting a widget, click “Save Changes”.
To swap widgets, hold the widget with the left mouse button and drag it without releasing the button.
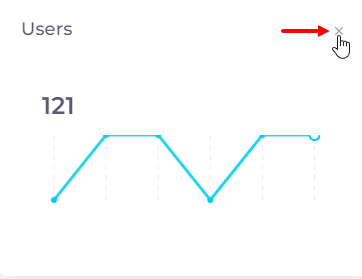
To remove a widget from the dashboard, click on the cross in its upper right corner:
Contents of the Dashboard
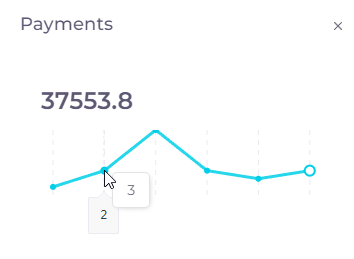
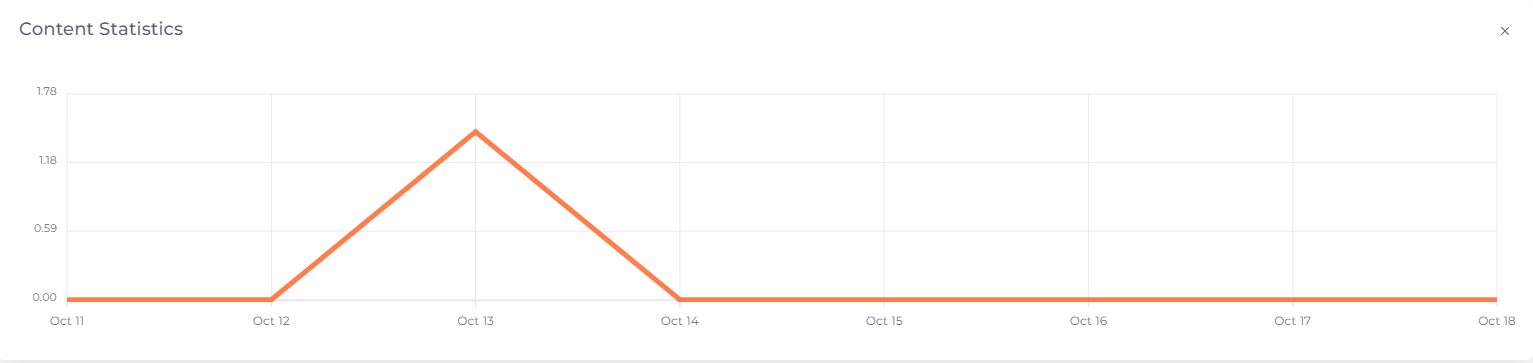
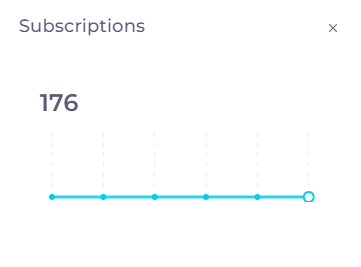
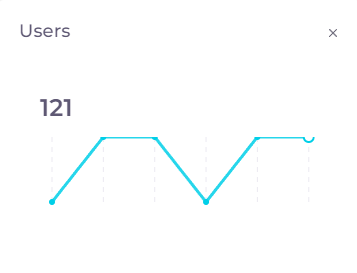
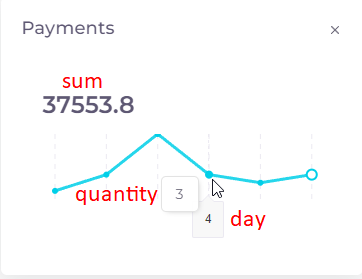
The dashboard may consist of several blocks of your choice. Each block represents a line graph. Hovering the cursor over a graph point in the widget allows you to see the exact graph parameter:
- Content statistics is a graph that shows the hours your content has been viewed by all users by day for the last week up to and including today.
- Subscriptions is a graph that shows the number of subscriptions that have appeared over the last week by day, as well as the total number of subscriptions for the entire time the platform has been running.
- Users is a graph that shows the total number of subscribers (online and offline together) by day for the last week up to and including today.
- Payments is a graph that shows the number of any payments received over the last week by day, as well as their total amount for the entire time the platform has been running.
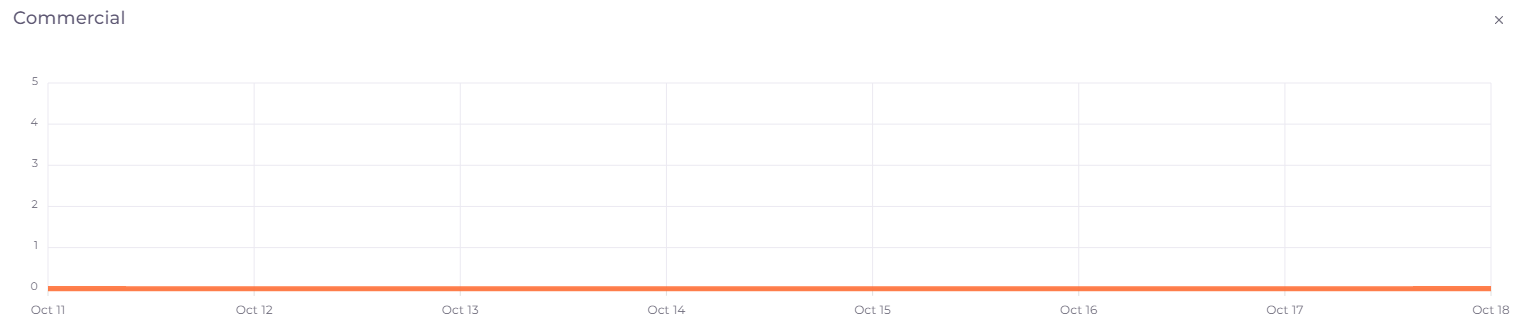
The numbers on the horizontal axis correspond to days: 6 is today, 5 is yesterday, 4 is the day before yesterday, and so on. - Commercial is a graph that shows the number of advertisement impressions for the last week by day.
- Active Subscriber Sessions is a list showing the total number of all active sessions of your subscribers for the last 24 hours, last 7 days, last 30 days and last 6 months.
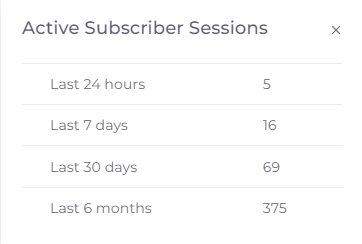
A session is the length of time a user is in the Telebreeze application, from the time the application is opened until it is closed. One user can have several sessions during the day. - Online Users is a graph that shows the total number of users who have been online in applications for any amount of time, by day for the last week up to and including today. In addition, the graph shows the total number of users online at the current point in time.
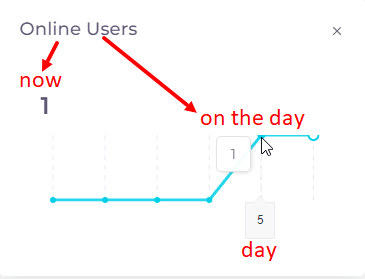
The numbers on the horizontal axis correspond to days: 6 is today, 5 is yesterday, 4 is the day before yesterday, and so on.