Statistics
Statistics is the last section of the left menu. It contains various statistical data on application usage by subscribers. These data are located on different tabs, which you can switch between.
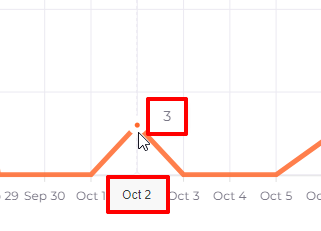
Hovering the cursor over a graph point will allow you to see its exact data:
Subscription Statistics
In the “Statistics” section, the first tab opens by default as the "Subscriptions". This is a line graph showing in dynamics the daily number of purchased subscriptions for the last month up to and including today:
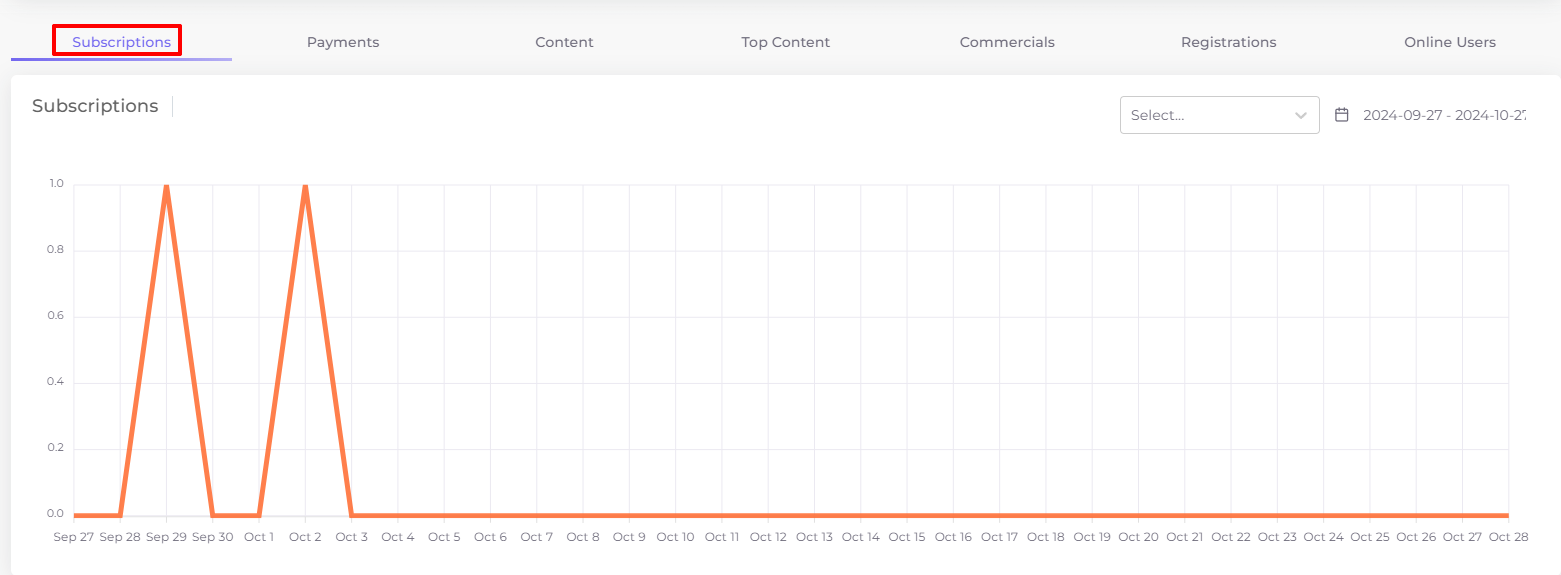
There are settings in the upper right corner of the chart:
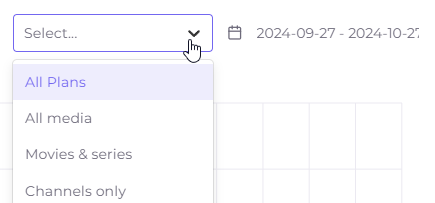
- Filter by tariff plans, which can be used to show the statistics of subscriptions for a particular plan.
- Report building period, it can be changed by clicking on it, then on the start date and then on the end date of the report.
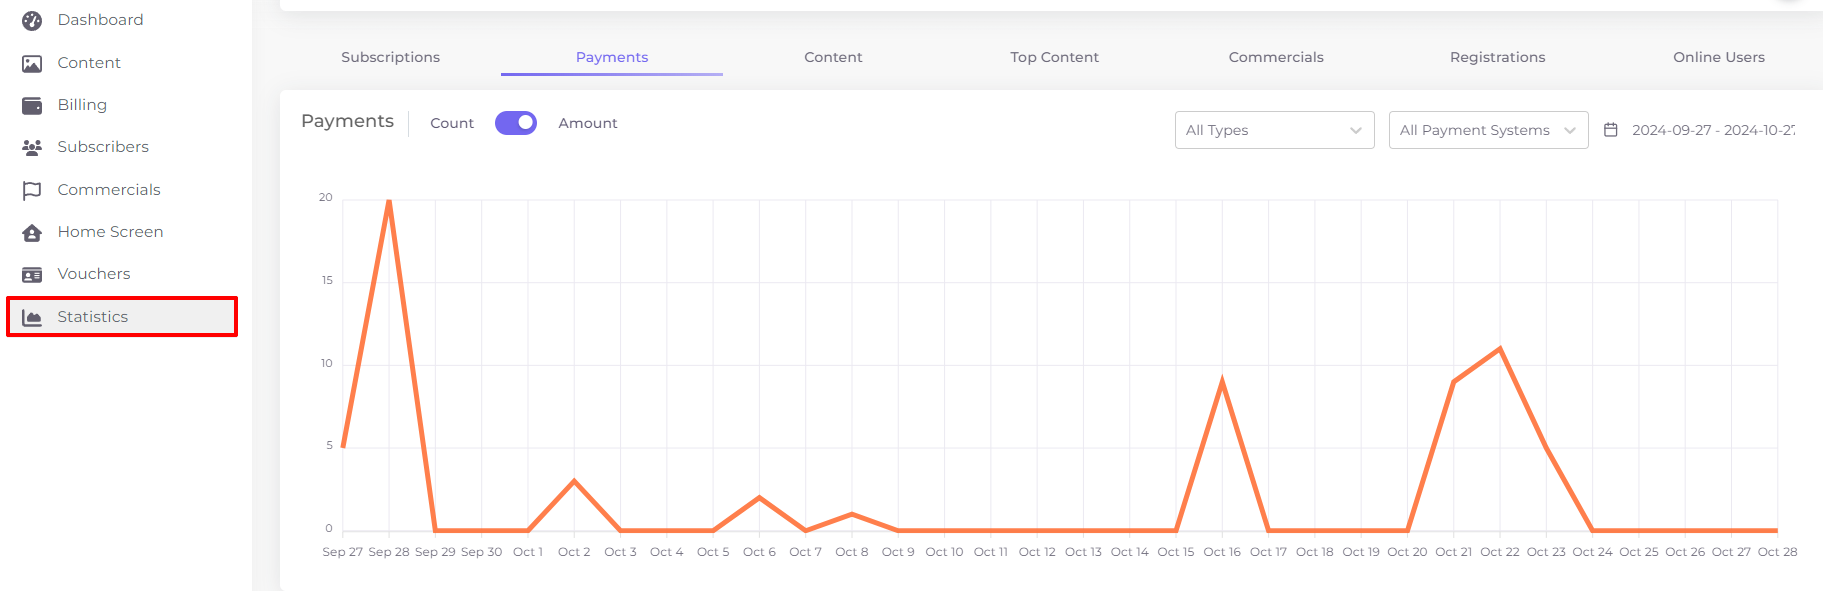
Payment Statistics
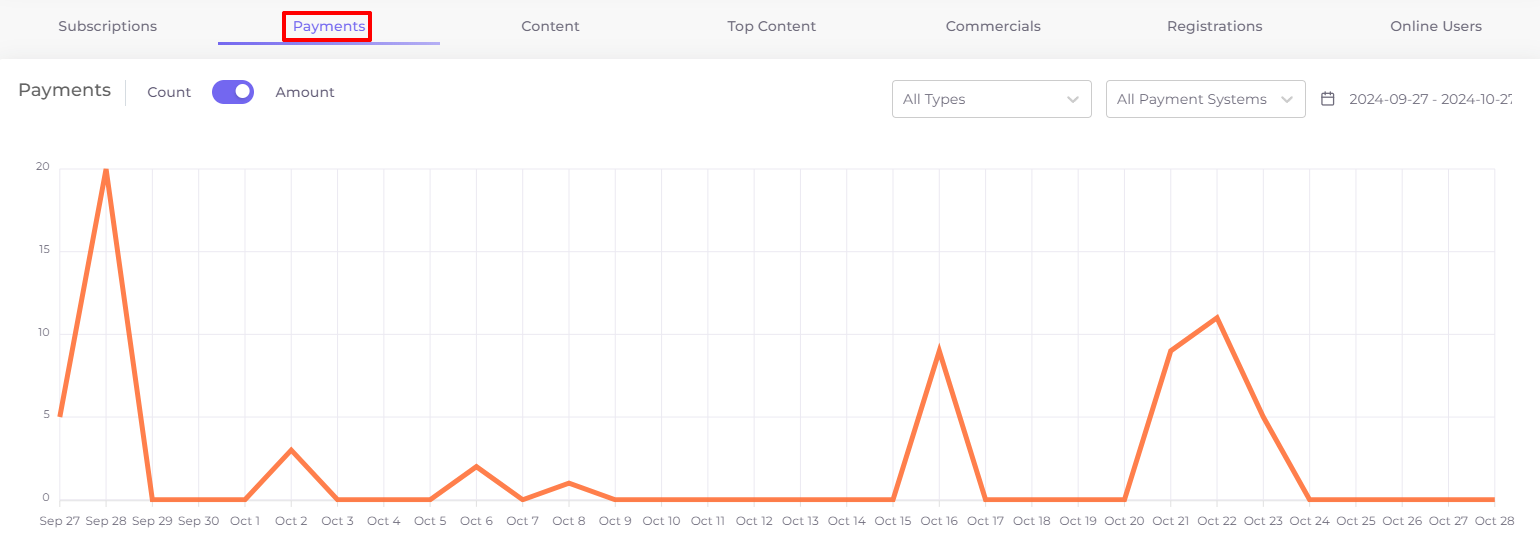
On the “Payments” tab in the “Statistics” section, you can see a line graph showing in dynamics the number or amounts of payments for each day in the last month up to and including today.
Above the chart there is a switch  , using which you can build the chart either by the number of payments or by the amount of payments.
The following settings are located in the upper right corner of the chart:

- The filter by payment type allows you to build a graph for a particular type of payment: balance (top-up of personal account), subscription or content (purchase of a separate unit of content).
- The filter by payment system allows you to build a graph of payments made by the selected system.
- Period of report building, it can be changed by clicking on it, then on the initial date and then on the final date of the report.
You can view a list of payments in Billing under the “Payments” tab.
Content Statistics
On the “Content” tab in the “Statistics” section, you can see the statistics of content consumption by subscribers. The main part of the tab is occupied by a line graph showing the amount or duration of daily content viewing for the last month up to and including today.
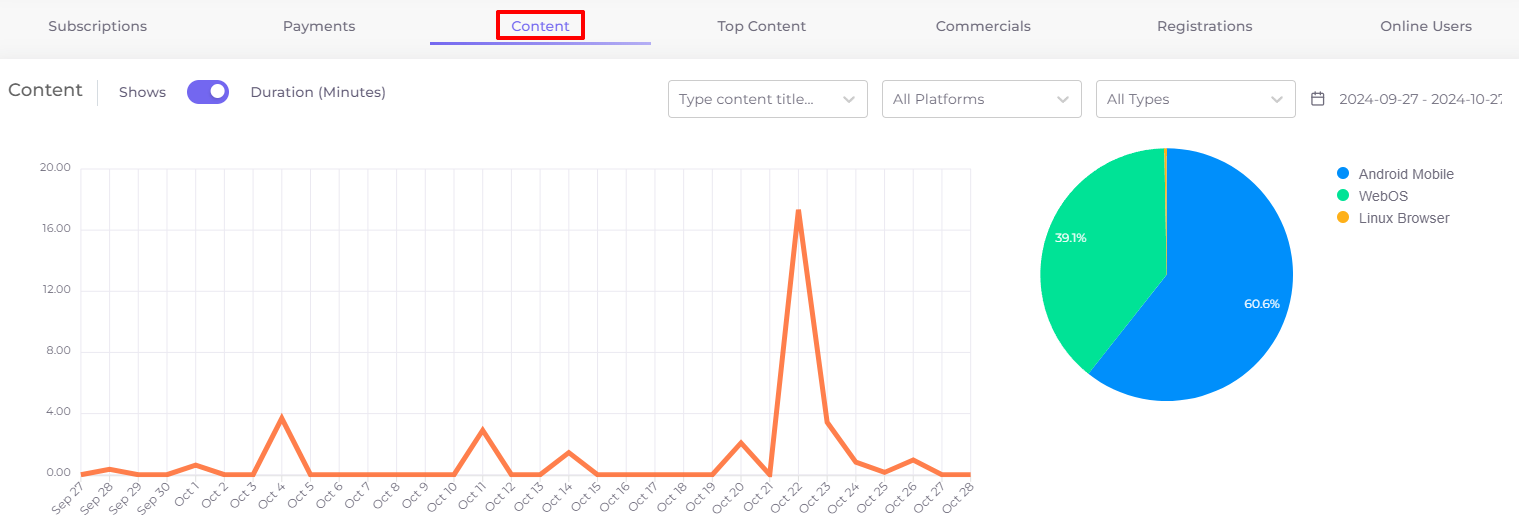
Above the graph is a toggle that allows you to plot the graph either by the number of views or by the total duration of daily content viewing: 
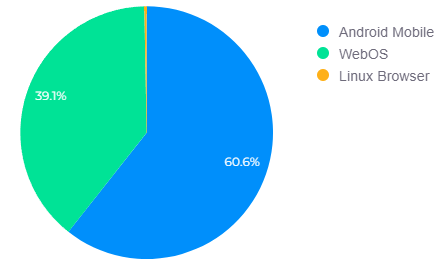
To the right of the graph is a pie chart showing the distribution of content by operating system as a percentage over the entire period:
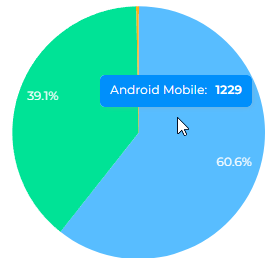
Hovering the cursor over the chart area allows you to see the total content viewing time in seconds in a given period for the selected operating system:
The following settings are located on the upper right side of the chart:

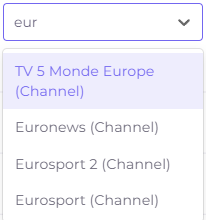
- The filter by content name allows you to see the viewing statistics of any content unit: a channel, an individual video, a series or a show. Start typing the name of the content of interest to select it:
- Filter by platform allows you to display viewing statistics from a specific operating system.
- Filter by content type allows you to display viewing statistics of all channels, all videos, all series or all shows.
- The period of report building, it can be changed by clicking on it, then on the start date and then on the end date of the report.
Top Content
In the “Top Content” tab in the “Statistics” section, a ranking of 100 positions of the most viewed content by total duration of viewing by all subscribers is automatically compiled, with direct sorting, starting from top to bottom with the content with the longest duration of viewing.
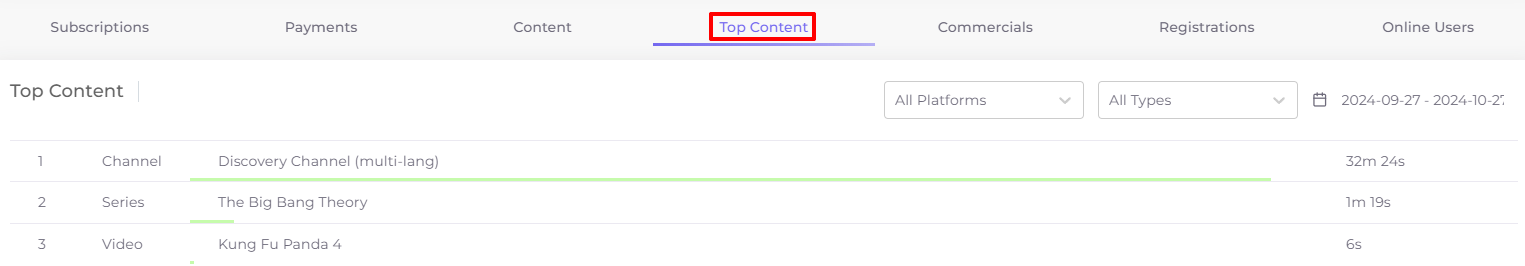
The rating has the form of a list. Each line of the list contains the type of content (channel, video, series or show), the content name, and at the end of the line - the total duration of its viewing by all users.
By default, the overall rating is compiled from all types of content: channels, videos, series, shows, and it includes views on all platforms. The period of views taken into account in the rating is one month by default, ending today inclusive.
At the top right of the table are the following settings:

- Filter by platform allows you to display viewing statistics for the top 100 items of top content from a single operating system.
- Filter by content type allows you to display viewing statistics of all channels, all videos, all series or all shows as separate 100 positions.
- The rating period, it can be changed by clicking on it, then on the start date and then on the end date.
Commercials Statistics
On the “Commercials” tab in the “Statistics” section you can see the statistics of all types of commercials (advertisements) shown to all subscribers. It is presented in the form of a graph with a period of one month ending today. This graph shows the number of advertisement impressions for each day:
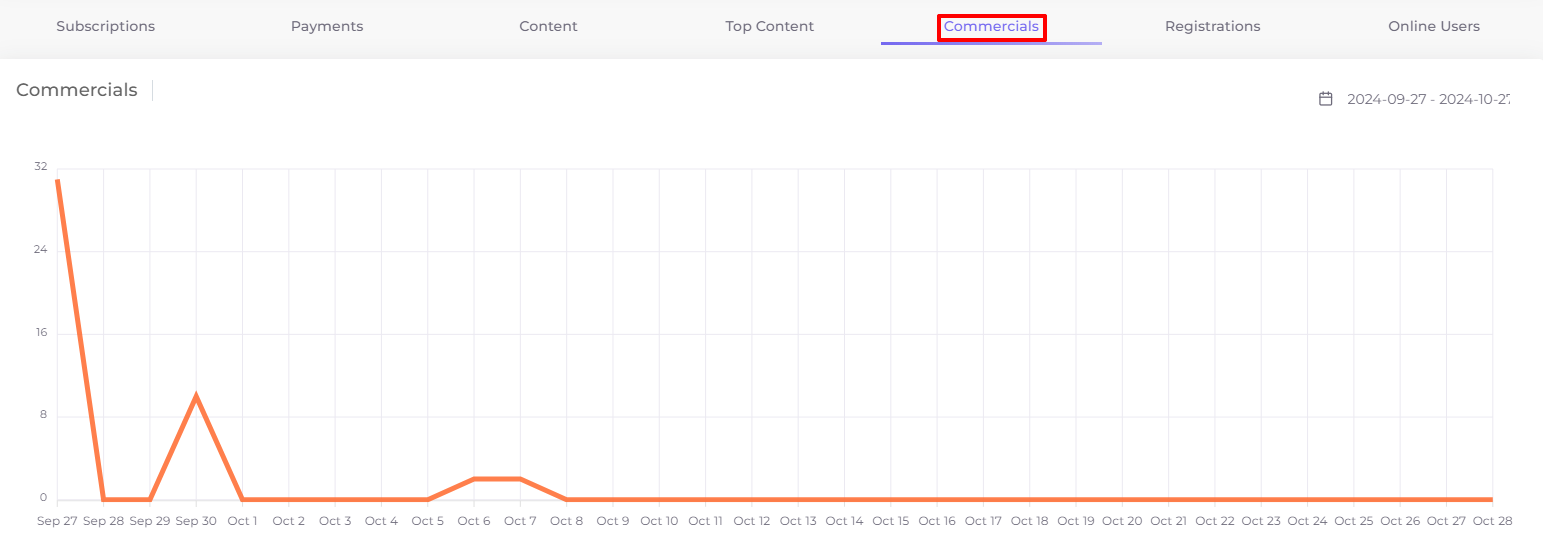
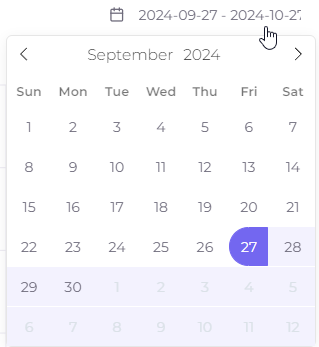
At the top right of the chart is the report building period, it can be changed by clicking on it, then on the start date and then on the end date of the report:
Registration Statistics
The “Registrations” tab in the “Statistics” section presents a graph of the number of daily registrations of new subscriber accounts.
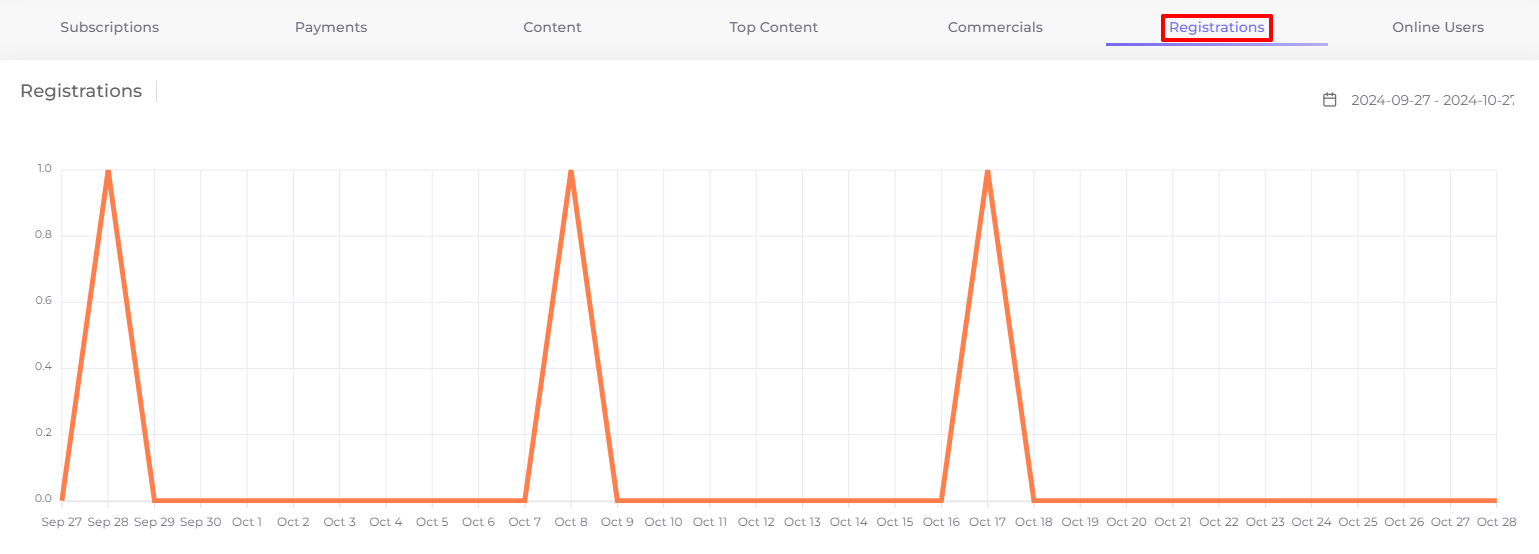
The default schedule period is one month up to and including the current date. But the period can be plotted at your discretion by clicking on it on the top right of the chart, then on the start date and then on the end date of the report:
You can view a list of all subscribers in the “Subscribers” section of the side menu.
Online Users Statistics
The “Online Users” tab in the “Statistics” section provides a graph of the total number of unique subscribers logged into Telebreeze's applications on each of the days shown.
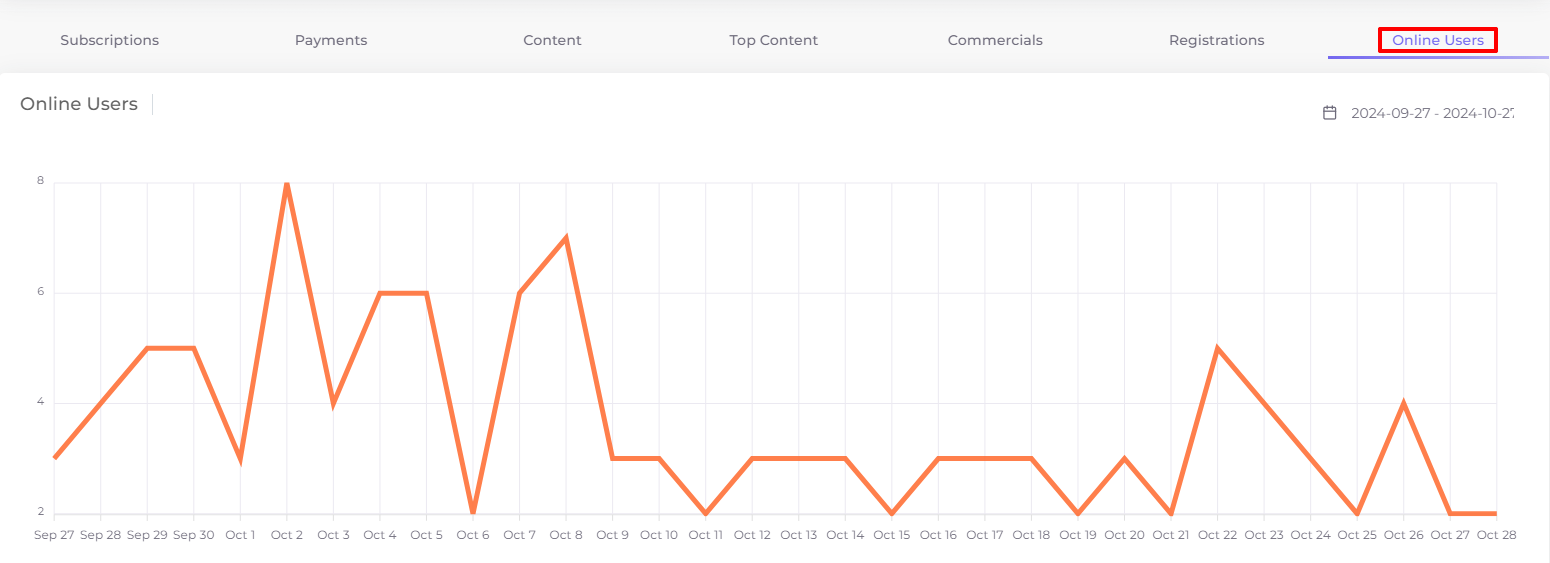
The default schedule period is one month up to and including the current date. But the period can be plotted at your discretion by clicking on it on the top right of the chart, then on the start date and then on the end date of the report: